How to Read a Strategy Tester Screenshot — and Why 65 Trades Isn't Proof
A backtest panel showing +61.20% in two months is the most checkable thing in trading marketing, because it hands you the four numbers you need to check it. Push on them and the profit holds up — the proof doesn't.
The most checkable artifact in trading marketing
Of all the ways trading results get shown to you, a strategy-tester panel is the one that gives most away. A chart shows you a shape and a P&L table shows you an outcome, but a tester prints total profit, maximum drawdown, win rate with the trade count, and profit factor — and from those four you can reconstruct the average winning trade, the average losing trade, the win rate the strategy needs just to break even, and how likely the whole run is if it has no edge at all.
That's a lot of leverage for four numbers. Here's the procedure on a real panel: an opening-range-breakout strategy on the 3-minute S&P 500 micro future, tested over two months and posted as proof of a subscription product. We're not naming it. Every panel you'll ever be shown has the same four fields.
Read the capital, not the percentage
The headline was +61.20%. A percentage is meaningless until you know what it's a percentage of, and the tester says so right in its settings bar: the test ran on $130,000 of capital. $79,562.50 on $130,000 is exactly 61.20%, so the figure is honest — as a description of a $130,000 account.
The marketing attached to it said you could start with as little as $1,000
. That is one hundred and thirtieth of the capital that produced the result, and the panel's own risk numbers don't survive the trip down:
- The $23,000 max drawdown is 23× a $1,000 account.
- The average losing trade — derived below — is $4,706, or 4.7× a $1,000 account.
- Futures don't divide. The micro contract used here is already the small one, worth roughly $39,000 of notional, and there is no fractional version of it to scale down into.
This is the single most common gap between a backtest and the pitch wrapped around it, and it needs no statistics to spot. A percentage return only transfers to you if you can hold the same position size. When the tested capital is two orders of magnitude above the advertised minimum, the percentage is not the number you'd get.
Recover the average trade
The panel doesn't print the average win and loss, but profit factor is defined as gross profit over gross loss, and you know the net and the trade split — so the algebra closes.
| Quantity | Value | |
|---|---|---|
| What the panel printed | Total PnL | +$79,562.50 (+61.20%) |
| Max drawdown | $23,000.00 (13.90%) | |
| Profitable trades | 55.38% — 36 of 65 | |
| Profit factor | 1.583 | |
| Test capital | $130,000 | |
| What you can derive | Gross loss = PnL ÷ (PF − 1) | $136,471 |
| Gross profit = PF × gross loss | $216,033 | |
| Average win = gross profit ÷ 36 | $6,001 | |
| Average loss = gross loss ÷ 29 | $4,706 | |
| Break-even win rate = avg loss ÷ (avg win + avg loss) | 43.95% |
Now sanity-check that against the instrument. An average win of $6,001 on a contract worth $5 an index point is 1,200 index points — if the strategy were trading one contract. The S&P does not travel 1,200 points inside a 3-minute opening-range trade. So the position is dozens of contracts at a time, and a large share of that 61.20% is size rather than signal.
That matters for two reasons. It tells you the leverage is doing real work, and it tells you the trade costs are multiplied by the same factor. It also leaves the audit stuck in dollars — until you find the position size, which the chart above the panel gives away.
The chart gives up the position size, and the size gives up the strategy
Trade markers carry the signed order quantity, not a price. On this chart the entries read Long +50
and −50 Short
, and the exits read −50 Session End
and Session End +50
— the sign flipping exactly the way a buy and a sell would. That's 50 contracts a trade, and it converts every dollar figure in the panel into index points you can check against the chart.
At 50 contracts the $4,706 average loser becomes 18.82 index points. Measure the strategy's stop line off the chart on three separate days and it sits 18.72, 18.99 and 18.72 points from entry — a mean of 18.81, a spread of one pixel. Two entirely independent measurements agreeing to 0.01 points pins the size down and tells you the stop is a fixed distance of about 75 ticks rather than something derived from each day's range.
It also tells you how the strategy makes money, which no single field on the panel does. Because the average loss equals the stop, essentially every loser is a full stop-out; the winners are the ones that survive to the exit, which the chart labels Session End
. Entries land 14 to 22 minutes after the cash open, one per session, at times that vary day to day — condition-driven, not clock-driven. Sixty-five trades across 43 sessions is 1.51 a day, so about half the days take a second entry after the first is stopped.
Then check the arithmetic closes. An expectancy of 4.90 points a trade, over 65 trades, at 50 contracts and $5 a point, is $79,562 — against the $79,562.50 the panel printed. When a reconstruction lands on the headline figure to the dollar, you have the strategy, not a guess about it.
What it looks like at the size you could actually trade
This is where the recovered size earns its keep, because now the advertised $1,000 minimum can be priced exactly instead of argued about. Scale the strategy to one contract — the smallest position that exists, since futures don't divide — and divide the panel's own figures by 50:
- Risk per trade becomes $94 — but that's 9.4% of a $1,000 account on every single trade.
- The max drawdown becomes $460 — which is 46% of that account, against the 13.90% the panel advertises.
Same strategy, same trades, same period. The drawdown percentage more than triples purely because you cannot hold 1/130th of the tested position. That gap is structural, not bad luck — and it is invisible on the panel, which reports its percentages against the capital it was given.
Check whether costs were charged at all
Backtesting platforms generally default commission and slippage to zero, and a screenshot of the results panel doesn't show you the properties tab where they'd be set. So look at the numbers themselves.
Futures move in fixed ticks, so a strategy's profit and loss can only land on multiples of the tick's dollar value — here $1.25. Divide the printed figures by it: total profit is 63,650 ticks, max drawdown 18,400 ticks, the buy-and-hold benchmark 2,232 ticks. All three are exact. Charge a real commission and the net stops landing cleanly on the tick grid, because broker fees aren't tick-sized.
Now be honest about that test, because on this panel it turns out to prove nothing. It only works when the total fee bill isn't itself a multiple of the tick — and once you recover the position size in the next section, you can check: at 50 contracts over 65 trades, a $0.62 round-turn commission comes to $2,015.00, a $1.04 one to $3,380.00, a $2.08 one to $6,760.00. All three are exact multiples of $1.25, so the alignment survives every realistic commission rate and tells you nothing at all here.
That's worth sitting with, because it's the shape of most forensic shortcuts: the test is sound, it just happens to be blind at this particular size. Zero cost is still the likely reading — but on the platform's default, not on the tick evidence. Run the check, then check whether the check could have failed.
Ask whether 65 trades can carry the claim
This is the test almost nobody runs, and it's the one that decides everything. With an average win of $6,001 and an average loss of $4,706, the strategy needs to win 43.95% of its trades just to break even. It won 55.38%. The gap looks comfortable — until you ask how precisely 65 trades can measure a win rate.
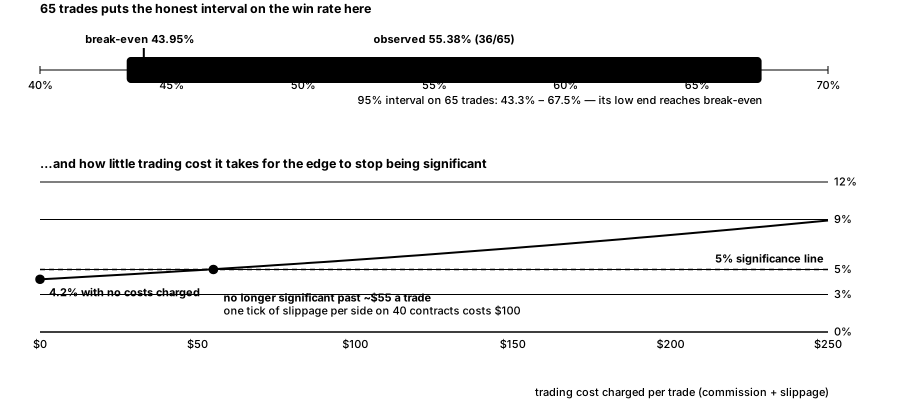
The 95% interval around a 36-of-65 win rate runs from 43.3% to 67.5% — and its lower end sits on break-even. Run it as a proper one-sided test and a system with no edge whatsoever produces a stretch this good 4.2% of the time. That clears the conventional 5% bar, but only just, on a single in-sample window, with no trading costs charged.
Now put the costs back. Every dollar of commission and slippage comes out of the winners and goes onto the losers, which pushes the break-even win rate up and the significance down. It takes only about $55 a trade to push this result past the 5% line — and one tick of slippage per side on forty contracts is $100 before commission.
What that does and doesn't mean
It does not mean the strategy is fake or that the numbers were doctored. The panel is internally consistent, the profit is large, and it stays large under realistic costs — roughly $60,000 to $70,000 rather than $79,562.
What it means is narrower and more useful: the profit survives costs, but the proof doesn't. Once you charge what trading actually costs, a two-month, 65-trade, single-instrument, single-timeframe result is no longer statistically distinguishable from a break-even system that had a good couple of months. That's not an accusation — it's a statement about how much evidence 65 trades contains.
It also tells you exactly what to ask for, which is the useful part: the same strategy run out-of-sample on data it wasn't built on, with commission and slippage configured, over enough trades that the interval closes. If the edge is real, that costs the seller nothing to produce. If it isn't, that's precisely the test it fails.
The checklist
- Find the test capital before you read the percentage. Then compare it to the minimum account the pitch advertises. If they're orders of magnitude apart, the percentage doesn't transfer.
- Convert the drawdown to dollars and hold it against that minimum account. A tidy 13.9% becomes 23× the account.
- Derive the average win and loss from profit factor and the trade split, then check them against what the instrument can actually move in one trade. That tells you the position size nobody mentioned.
- Read the order quantity off the trade markers. They carry a signed size, not a price. It converts the panel's dollars into index points you can measure against the chart — and it is the number that makes every other check possible.
- Divide the results by the tick value to test for uncharged costs — then check whether a realistic fee bill at that position size would also land on the tick grid, because if it would, the test told you nothing.
- Rescale the whole thing to one contract before believing any advertised minimum. Here that turns a 13.9% drawdown into 46% of a $1,000 account.
- Compute the break-even win rate — average loss over the sum of the averages — and see how much daylight there really is.
- Count the trades. Under a hundred, the interval on the win rate is wide enough to swallow most claimed edges.
- Check the window. Two months of one instrument on one timeframe, with no out-of-sample split shown, is a hypothesis, not a result.
What a tester panel can never show you
Everything above comes from one screenshot and describes that screenshot. We can't see the strategy's code, its properties tab, its trade list, or whether the parameters were chosen after looking at this exact window — which is the failure mode no panel can ever reveal about itself, and the reason out-of-sample testing exists at all.
We also can't see live fills. A tester assumes you got filled at its price, and a breakout strategy sending dozens of contracts into a 3-minute range break is precisely the case where that assumption is most generous. That gap doesn't show up as a red number anywhere on the panel; it shows up in your account.
Questions, answered
Is a TradingView Strategy Tester result proof that a strategy works?
No — it's a backtest, and backtests default to zero commission and zero slippage unless someone sets them. It's a hypothesis worth testing out-of-sample, not evidence of live performance. The panel we audited showed +61.20% over two months and 65 trades, which is too few trades to distinguish a real edge from a good run once costs are charged.
How do you calculate average win and average loss from profit factor?
Gross loss = net profit ÷ (profit factor − 1), and gross profit = profit factor × gross loss. Divide each by its trade count. On the panel here: $79,562.50 ÷ 0.583 gives a $136,471 gross loss and a $216,033 gross profit, so the average win is $6,001 over 36 wins and the average loss is $4,706 over 29 losses.
What is a break-even win rate?
The share of trades a strategy must win to make nothing, given its payoff ratio: average loss ÷ (average win + average loss). Here that's 43.95%, against an observed 55.38%. It's the number that tells you whether a win rate is actually good — a 55% win rate can be losing money and a 35% one can be highly profitable.
How many trades does a backtest need?
More than 65. At that sample the 95% interval on a 55.38% win rate runs from 43.3% to 67.5%, and the lower end reaches break-even. A one-sided test puts the odds of a no-edge system producing that run at 4.2% with no costs charged — which rises past the conventional 5% threshold once you charge about $55 a trade in commission and slippage.
How do you tell what position size a backtest used?
Read the trade markers on the chart — they show the signed order quantity, so “Long +50” means 50 contracts bought and “−50 Session End” means the same 50 sold to flatten. That converts the panel's dollar figures into index points: here the $4,706 average loss becomes 18.82 points at 50 contracts, which matched the stop measured off the chart to 0.01 points.
Why does the backtest capital matter more than the percentage?
Because a percentage return only transfers if you can hold the same position size. This panel ran on $130,000 while the pitch advertised a $1,000 minimum — 130× apart — and its $23,000 drawdown and $4,706 average loser are 23× and 4.7× that minimum account. Futures contracts don't divide, so there's no way to scale the result down.
Is this financial advice?
No. It's a worked example of auditing a public backtest screenshot. It isn't a recommendation about any strategy, product, platform or trade.
Every figure on this page was derived from the four numbers one publicly posted strategy-tester panel printed — profit, drawdown, win rate and profit factor — not supplied by the poster and not produced by our backtest engine. Educational information only — not investment advice. Hypothetical backtested results; past performance does not guarantee future results. Trading involves risk of loss.
Keep reading
Get the weekly edge report
The best-performing indicator per asset, what changed this week, and the honest caveats — straight to your inbox.