How to Audit a Trading Bot's Profit Screenshot — the Balance Column Gives It Away
A bot's 15-day results table added up perfectly: every figure in the profit column was real and the total was exact. Making the columns argue with each other showed that a third of the account's growth was money deposited, not money earned.
A table is a bigger claim than a chart
A results chart shows you a shape. A results table shows you columns — and columns have to agree with each other. That makes a table far easier to check than the person posting it usually expects, because you don't need any outside data to do it. You only need the table to be consistent with itself.
What follows is a worked example on a real one: fifteen days of a trading bot's daily profit, daily volume and end-of-day account balance, posted publicly alongside a claim of a stable ~$100 a day
. We're not naming the account, because the account isn't the point and the same four tests work on any of these.
Test 1 — does it agree with itself?
Add the columns up. In this case the profit column summed to exactly the stated total of $2,087.66, and the volume column came to $2,490,657 against a stated $2,490,656 — a one-dollar rounding. Nothing was fabricated and nobody fat-fingered a row.
That matters, and it's also where nearly everyone stops. Passing this test only establishes that the arithmetic inside the picture is clean. It says nothing about whether the picture describes what you think it describes — which is what the next test is for.
Test 2 — make the columns argue
Two of these columns are related by definition: whatever the account earned in a day should show up as the change in its balance. So compute the balance change day over day and subtract the reported profit. On an account with no money moving in or out, that difference is zero every day. Anywhere it isn't, something happened that the profit column doesn't describe.
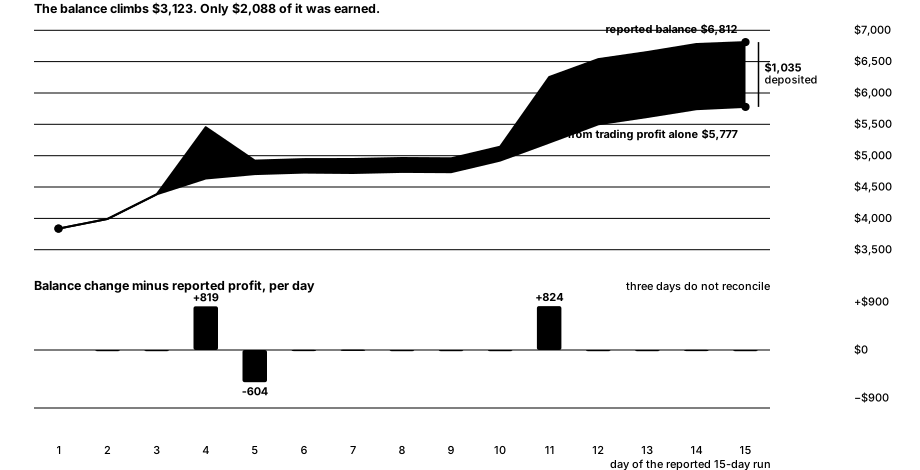
Three days don't reconcile: +$819, −$604 and +$824, netting about +$1,039 of capital moving in. So the account that appears to climb from roughly $3,689 to $6,812 — a $3,123 rise that reads as performance — actually earned $2,088 of that and had about $1,035 handed to it. A third of the growth is deposits.
One detail closes off the innocent explanation: this column is the total balance across venues, so shuffling money between the poster's own exchange accounts can't produce a jump in it. The money came from outside.
The same test turns up something smaller and more interesting. On four other days the two columns disagree by $3.70 to $5.50 with no corresponding transfer. That means the profit column is not simply the change in the balance — it's a separate accounting figure, most likely realised P&L. And a realised-only number is exactly the kind that can look calm while open positions do not.
Test 3 — size the machine
Now ask what kind of business the numbers describe. Divide total profit by total notional traded, and total notional by the average balance.
| What we measured | Figure | What it tells you |
|---|---|---|
| Average balance | $5,372 | The account is small — so every other number has to be read against it. |
| Notional traded, 15 days | $2,490,657 | 464× the account in 15 days; about 31× every single day. |
| Profit per dollar traded | 8.38 bps | Eight hundredths of one percent. This is a fee-and-spread business, not a forecast. |
| Correlation, volume vs bps | −0.02 | Trading harder didn't earn more per dollar — daily edge ran from −1.9 to +19.1 bps. |
| Reported return on avg balance | +38.9% | In 15 days. Large enough that the risk behind it is the only question worth asking. |
Eight basis points of notional is not a forecasting edge; it's the margin of a market-making or spread-capture operation. That reframes everything. A strategy in that business makes money as a function of how much it trades, what fee tier it sits in and what rebates it collects — and it carries inventory risk that cannot appear in a column of daily profits. The number you'd actually need is the largest position it held and how far offside it went, and no results table has ever volunteered that.
It also sets the honest expectation for anyone copying it. At 31× daily turnover, your results are hostage to your own fee tier. Start on worse terms than the poster and an 8-basis-point edge is simply gone.
Test 4 — look at the shape of the losses
Thirteen of the fifteen days are green. That's not the interesting part. The interesting part is that both red days are −$5.71 and −$5.38 — about a tenth of one percent of the account — while the best day is +$392, or 7.3% of it. The average winner is 29× the average loser.
Be careful with what that does and doesn't prove. Fifteen days is far too short to call it impossible, and a genuinely market-neutral book really can grind out small flat days. But the window contains no market stress, which means the sample cannot distinguish market-neutral by construction from hasn't met its bad day yet — and if you can't tell those apart, you don't yet know what you're copying.
It's also worth noticing which days were red. One of them turned over $218,358 — the third-largest volume in the run — for a loss of $5.38. Churning a fifth of a million dollars to end the day flat is what this kind of strategy looks like when the market doesn't cooperate.
The word the table doesn't support
The claim attached to the picture was stable
. Measured: the median day is $124.35 and the standard deviation is $122.56 — the spread is as large as the middle. Six of the fifteen days come in under $75, and the range runs from −$5.71 to +$392.07.
When the standard deviation of a series equals its median, stable
is doing work the numbers don't. This is the cheapest check in the whole piece and it needs nothing but the column you were already shown.
The last test isn't arithmetic: who gets paid when you trade?
Bots like this usually reach you attached to something — a referral link, an exchange sign-up code, a rebate share. When they do, the person distributing the bot is paid out of the fees your trading generates. Their revenue is a function of your volume, and it does not depend on your profit at all.
Set that against Test 3. This strategy turns over 31× the account every day. Whatever it does for the person running it, it is close to the most profitable thing a referred user can possibly do for the referrer. That is not evidence of bad faith — plenty of people share tools they genuinely use — but it is a conflict of interest you should price in, and it should raise the standard of proof you ask for rather than lower it.
There's a tell for it, too, and it's usually sitting in plain sight: check whether the post is more concerned with the strategy or with how many people have signed up underneath it.
The checklist
- Sum every column. Free, fast, and it tells you whether you're auditing a document or a drawing. Passing is the start, not the finish.
- Difference the balance column and subtract the P&L column. Non-zero days are deposits, withdrawals, or an accounting definition you haven't been told about. This is where a third of the growth was hiding.
- Divide profit by notional traded. A few basis points means fees and spreads; a few percent means direction. They have completely different risks and completely different reasons to fail on you.
- Divide notional by balance. High turnover means your fee tier, not the code, decides your result.
- Compare the worst day to the best day. If losses are capped at a tenth of a percent while wins run to seven, ask what isn't being marked — and how long the sample is.
- Test the adjective.
Stable
,consistent
,steady
are all claims about variance, and variance is computable from the numbers you were handed. - Ask who is paid when you trade. If the answer is the person who gave you the bot, weight everything above accordingly.
What this can't tell you
Everything above comes from one publicly posted image, and it describes that image only. We could not verify the underlying code — it wasn't linked from the post — so nothing here is a claim about what the software does or doesn't do. We can't see open positions, inventory, leverage, which venues were used, or what happened before day 1 or after day 15.
And to be explicit about the conclusion: none of this shows the strategy loses money. It may well be a competent market-making bot. What the audit shows is narrower — that the screenshot doesn't establish that it makes any, because a third of the headline growth was deposited, the profit figure is a realised number that can't show open risk, and fifteen calm days is not a sample. Those are the grounds on which to ask for more, not the grounds on which to conclude anything.
Questions, answered
How do you check if a trading bot's profit screenshot is real?
Start inside the picture. Sum every column against its stated total, then difference the balance column and subtract the reported profit day by day — on an account with no transfers that should be zero every day. In the table we audited it was zero on twelve days and +$819, −$604 and +$824 on three, which revealed about $1,035 of deposits inside a $3,123 rise.
Can deposits make a trading account look profitable?
Yes, and it's the most common way a real, unfabricated table misleads. The balance column climbs, the eye reads performance, and nothing in the picture separates money earned from money added. Reconciling the balance against the P&L column separates them in about a minute.
What does profit per dollar traded tell you about a strategy?
It tells you what business it's in. A few basis points of notional — 8.38 in this case — is market-making or spread capture, where results depend on turnover, fee tier and rebates, and where inventory risk never appears in a daily profit column. A few percent of notional would mean it's taking directional risk instead. The two fail in completely different ways.
Is a high daily win rate evidence a bot works?
Not on its own. In this run 13 of 15 days were green, but both losing days were about a tenth of a percent of the account while the best day was 7.3% of it. Losses that small on a strategy turning over 31 times the account daily are worth questioning, and fifteen days without market stress can't tell you whether the calm is by construction or by luck.
Why does it matter if a bot comes with a referral link?
Because referral and rebate arrangements pay the distributor out of the fees your trading generates, so their income tracks your volume rather than your profit. A strategy that trades 31 times the account per day is close to the best possible outcome for the referrer regardless of how it ends up for you. It isn't proof of bad faith, but it's a conflict that should raise your standard of proof.
Is this financial advice?
No. It's a worked example of auditing a public results screenshot. It isn't a recommendation about any strategy, bot, venue or trade.
Every figure on this page was computed from one publicly posted results table — summed, differenced and reconciled against itself, not supplied by the poster and not produced by our backtest engine. Educational information only — not investment advice. Hypothetical backtested results; past performance does not guarantee future results. Trading involves risk of loss.
Keep reading
Get the weekly edge report
The best-performing indicator per asset, what changed this week, and the honest caveats — straight to your inbox.